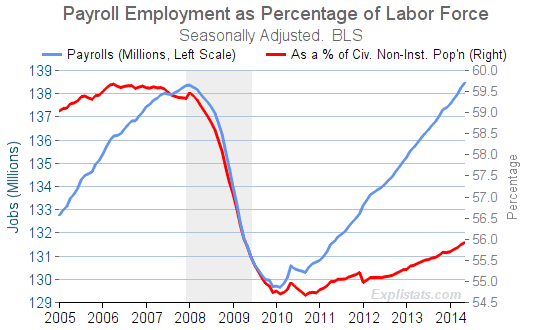
Much has been made of May’s payroll employment exceeding its pre-recession peak.
| January 2008: | 138.365 Million Jobs |
| April 2014: | 138.246 |
| May 2014: | 138.463 |
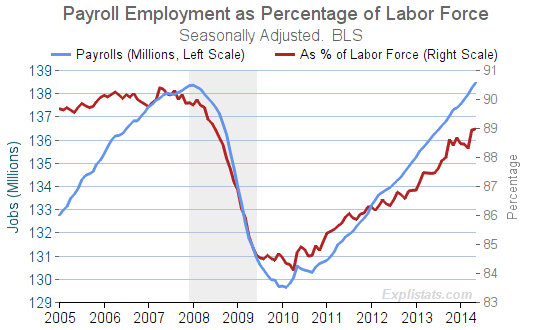
However, in the intervening years the overall US Population has grown. In the chart below we compare the nominal payroll numbers with payrolls expressed as a percentage of the U.S. Civilian Non-Institutional population 16 yrs and over, and as a percentage of the Labor Force.

Click to enlarge
Because the Labor Force has over the same period shrunk as a percentage of the overall population, the disparity is not quite so striking.

Click to enlarge
