The Bureau of Labor Statistics will publish the results of their Payroll Employment Survey for October 2014 on Friday, November 7th.
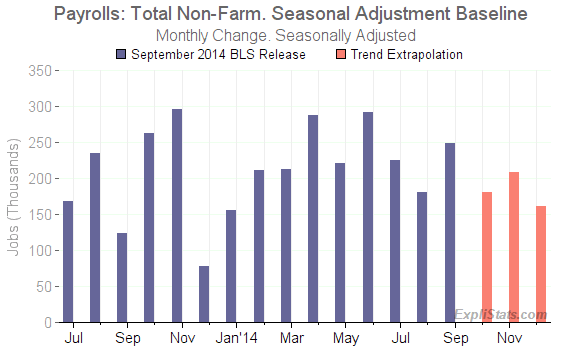
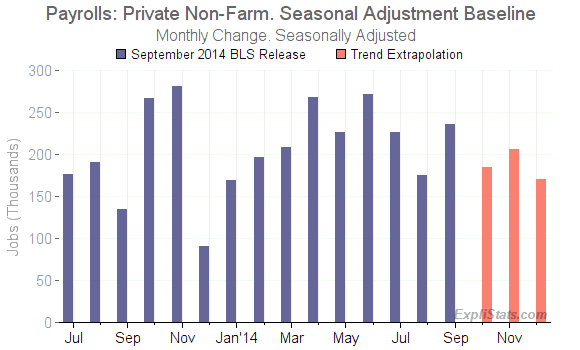
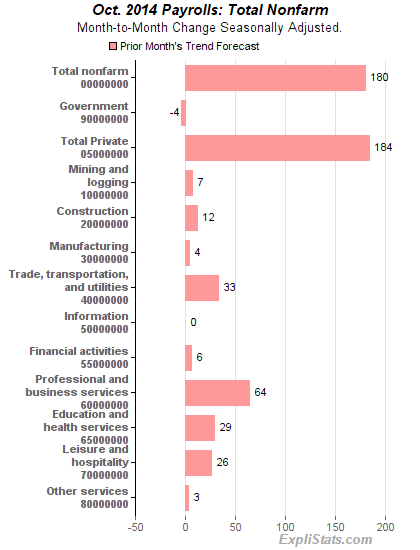
Here are the mathematical trend numbers which are produced in advance by the ExpliStats modeling of the BLS seasonal adjustment process. The trends here are what could be expected for October, given the seasonally-adjusted BLS trends established through September.
The numbers are sharply lower than both September’s gains and current expectations for October.
This is due to mathematical biases in the current Seasonal Adjustment process.
| Total (incl. Govt.) | Private | |
|---|---|---|
| October Trend (1) | +180,000 | +184,000 |
| September Actual (2) | +248,000 | +236,000 |
 Click to enlarge |
 Click to enlarge |
|
| (1) Calculated using September release, (2) Initial BLS Estimate which will be revised next month. | ||
Click to enlarge
The Seasonal Adjustment Process
Most industries see job levels rise and fall due to the time of year. In order to get a view of any underlying, non-seasonal changes, a mathematical procedure is used to “seasonally adjust” the data, stripping out calendar effects.
The mathematics used by the Bureau of Labor Statistics in seasonally adjusting the raw payroll data is complex. It has a difficult task and does not perform perfectly. There are residual biases in the output numbers and these will tend to persist in future months, although they will change as new data are fed in each month.
Essentially, the trend shows what would happen if the underlying momentum of the jobs growth seen in recent months were to continue with no major reporting omissions by employers in the coming month, no major revisions to prior months’ employers reports, or labor strikes.
As such, our initial interest lies in examining the effect of seasonal adjustment “momentum” on the BLS numbers, and in looking at differences in the trend and actual numbers to see what changes really are taking place in the labor market.
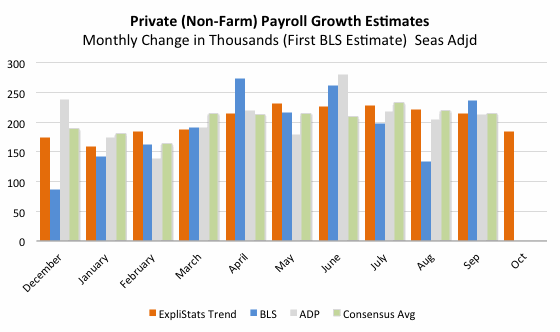
However, the trend numbers do seem to have some predictive power, proving slightly closer, on average, to the BLS published numbers than is the consensus or the ADP Employment Report, over the past few months.
Historical Comparisons
In the chart below we compare the Trend Forecast with both the subsequently reported Consensus of economists’ forecasts as polled by Bloomberg. The Trend Forecast has tended to be a slightly better predictor of the BLS number than has the Consensus.,
Trend does a better job of anticipating the eventual Consensus (which is first published in the week before, and changes up to the date of the BLS Release.)
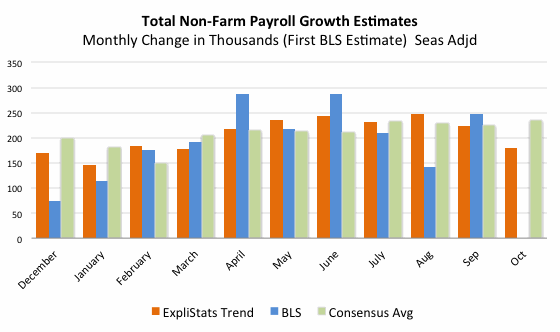
Click to enlarge
(NOTE: In the chart above we have used the current Consensus figure for October from MarketWatch.com. Bloomberg hasnot yet published a figure.)
And, in the chart below we look at the Private sub-sector headline number, where we can also bring in and compare the ADP Employment Report (published two days before the BLS Release).
