The reported October jobs gains surprise on the upside. Looking at the nature of the revisions to August and September, however, raises questions about the quality of the underlying survey respondents’ reporting, and how subsequent revisions affect the whole seasonal adjustment pattern.
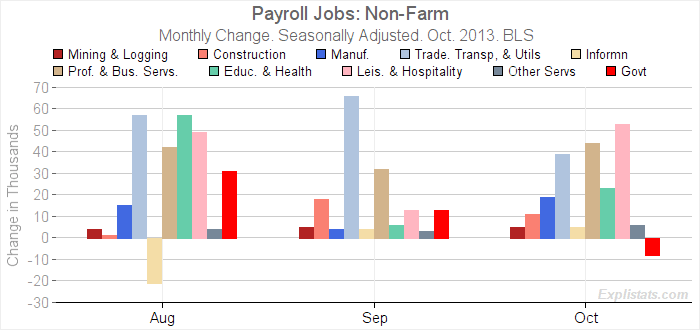
Total private non-farm payrolls were reported up by 212,000 in October which, when added to a 12,000 reduction in Government jobs, yields a total non-farm jobs gain of 204,000. In the chart below we look at what the major industry sectors contributed to these gains.
Click to enlarge
What were the significant moves in relation to our October forecast seasonal adjustment biases? (See previous post)
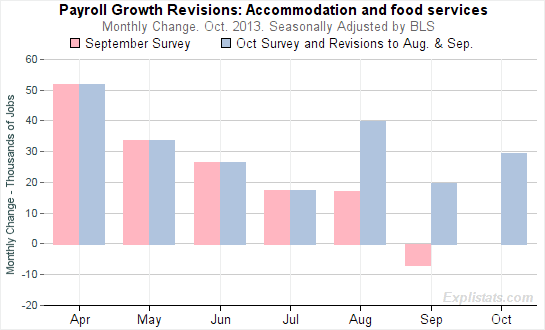
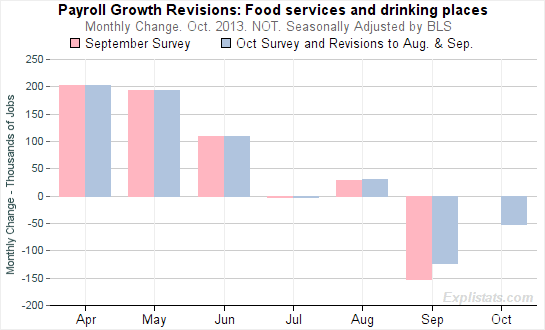
Leisure & Hospitality (+53,000). We correctly anticipated an upward revision to August jobs in Food Services (+20,000). We estimated that the baseline October bias towards a loss of 5,000 jobs would be better predicted as a gain of 15,000. We were over-cautious: Reported October gains for this sub-sector (part of Leisure & Hospitality) saw a gain of 29,000.
In addition, this one sub-sector saw revised gains in August and September of 60,000 combined. That was on a seasonally-adjusted basis. However, the underlying actual reported job gains (before seasonal adjustment) hardly changed. See the two charts below. This shows us how sensitive the seasonal adjustment process is and how easily it can create or destroy jobs.
Click to enlarge
Click to enlarge
Compare the August changes. The addition of late-reporting firms’ data resulted in 3,000 new jobs (before seasonal adjustment) and yet the new seasonal factors create in excess of 20,000 new jobs in August, after seasonal adjustment.
Trade & Transportation (+39,000). Significant counter-trend move came in Retail Trade (+44,400) as opposed to the base-line bias of only +17,000.
Professional and Business Services (+44,000) as against a base-line of only +26,000.
Health Services (+23,000) as opposed to a baseline of 30,000.
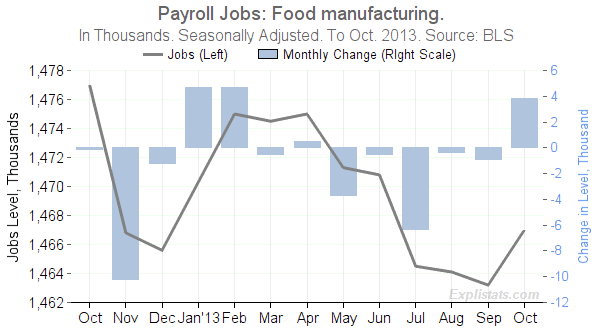
Manufacturing (+19,000). The baseline was pointing to only +2,000. It did not foresee a reversal in the downtrend in Non-Durable goods. The chart below shows the culprit: Food Manufacturing. A small and volatile series, which nevertheless accounted for a 15,000 gain over and above the baseline forecast. It is interesting that Food features big moves in both retail and manufacturing.
Click to enlarge
Smoothed Growth
We update here, our three-month moving average of overall jobs growth to date.
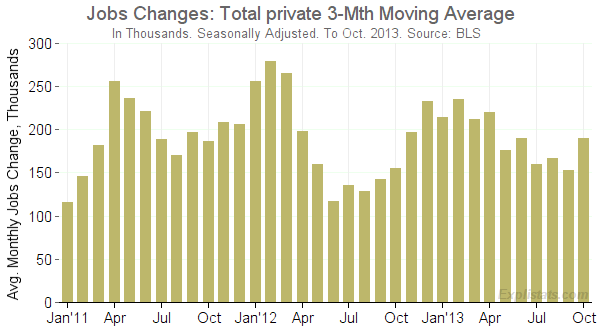
Click to enlarge
We intend to take a fuller view, next week, of the seasonal factor distortions and any likely revisions for the November report.