The Seasonal Adjustment Process
Most industries see job levels rise and fall due to the time of year. In order to get a view of any underlying, non-seasonal changes, a mathematical procedure is used to “seasonally adjust” the data, stripping out calendar effects.
The mathematics used by the Bureau of Labor Statistics in seasonally adjusting the raw payroll data is complex. It has a difficult task and does not perform perfectly. There are residual biases in the output numbers and these will tend to persist in future months, although they will change as new data are fed in each month.
We look at these BLS biases with a view to preparing for the October numbers, due out this Friday, November 8th.

Click to enlarge
Applying the biases with no changes in trend
To get a feel for the effect of these biases, we compute what the next few months’ reported growth in payrolls would be, if:
- The underlying momentum of the jobs growth seen in recent months were to continue.
- No major reporting errors caused by employers failing to report their survey data on time
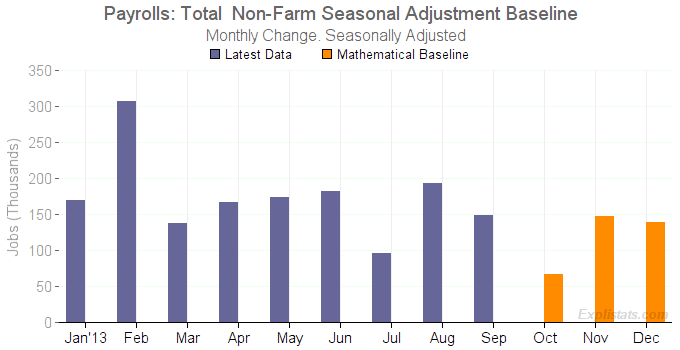
The results for October overall payroll numbers are shown in the chart above, and table below. This is what we have previously referred to as the “trend forecast”. There is significant mathematical pressure on October compared with September (and this is without any effects of the Federal Government shutdown.)
Now, both of the assumptions (1) and (2) are significant, and so our bias-numbers cannot be treated as a forecast, but more of a “baseline”. If the effect of (2) is small, then we can look at how the actual October numbers compare with this baseline and deduce from that something about any change in momentum.
However, for October, we believe that there may have been some under-reporting in September (Food Services sector) which if corrected would tend to boost October’s reported number – maybe by as much as 20,000.
So, we give two sets of numbers: Baseline, and baseline plus revision adjustment.
Mathematical Baseline Numbers
| Sector | Baseline | With Modification |
|---|---|---|
| Total Non-Farm | 67,000 | 88,000 |
| Private | 89,000 | 110,000 |
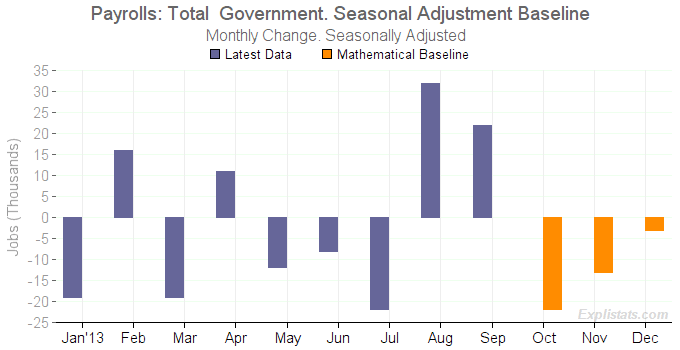
| Government | -22,000 | -22,000 |
Government Shutdown

Click to enlarge
The BLS has decided to count furloughed government employees as employed for the purposes of the payroll survey, so the government sector jobs number should not be affected.
Our calculation of the BLS’ 22,000 bias drop comes partly from a continued down-trend in Federal workers, and partly from seasonal catch-up in the State and Local Government education sectors.
