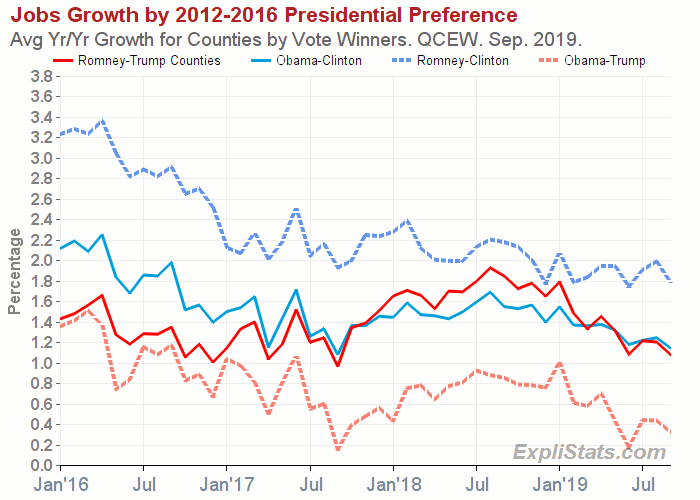
Combining the latest QCEW employment data with the county-level Presidential Election results of 2012 and 2016, we produced the following chart. We have divided all US counties into four groups depending on which Presidential candidate they had majorities for in 2012 and 2016.
Latest data, published March 4, 2020 by the Bureau of Labor Statistics gives employment levels to September 2019.

