From the Federal Reserve’s G.17 Report:
Industrial production increased 0.1 percent in February after decreasing 0.3 percent in January. In February, manufacturing output moved down 0.2 percent, its third consecutive monthly decline. The rates of change for the total index in January and for manufacturing in both December and January are lower than previously reported. The index for mining fell 2.5 percent in February; drops in the indexes for coal mining and for oil and gas well drilling and servicing primarily accounted for the decrease. The output of utilities jumped 7.3 percent, as especially cold temperatures drove up demand for heating. At 105.8 percent of its 2007 average, total industrial production in February was 3.5 percent above its level of a year earlier. Capacity utilization for the industrial sector decreased to 78.9 percent in February, a rate that is 1.2 percentage points below its long-run (1972–2014) average.

Click to enlarge
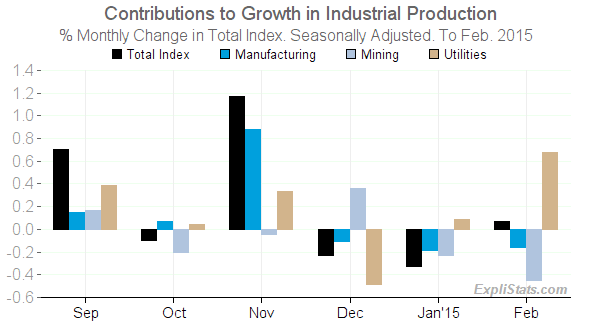
The 0.07% rise in total production was the result of the contributions from various industries as shown in the table and charts below.
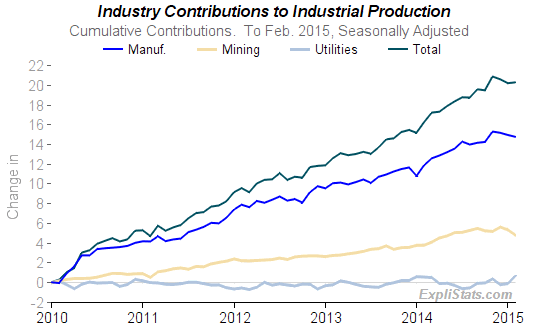
For charts and tables of individual sector growth, please visit our Latest Industrial Production Charts and Tables Page.
| U.S. Industrial Production – Major Industry Groups Contribution to Total Index of each Industry Group. Seasonally Adjusted. | |||||||||
|---|---|---|---|---|---|---|---|---|---|
| Total Index % Points Change by Sub-Index | Monthly Change (Pts) | 3-Month Change (Pts) | Year/Year Change (Pts) | ||||||
| Dec. 2014 | Jan. 2015 | Feb. 2015 | to Aug. 2014 | to Nov. 2014 | to Feb. 2015 | Dec. 2014 | Jan. 2015 | Feb. 2015 | |
| Total index | -0.23 | -0.32 | 0.07 | 0.74 | 1.79 | -0.48 | 4.44 | 4.36 | 3.47 |
| – Manufacturing (SIC) | -0.10 | -0.18 | -0.16 | 0.66 | 1.10 | -0.44 | 3.04 | 3.61 | 2.47 |
| – – Durable manufacturing | -0.15 | -0.07 | -0.24 | 0.40 | 0.68 | -0.46 | 2.20 | 2.49 | 1.49 |
| – – Nondurable manufacturing | 0.07 | -0.12 | 0.08 | 0.32 | 0.49 | 0.03 | 1.02 | 1.28 | 1.13 |
| – – Other manufacturing | -0.02 | 0.00 | 0.01 | -0.06 | -0.07 | -0.01 | -0.17 | -0.16 | -0.15 |
| – Mining | 0.36 | -0.23 | -0.45 | 0.48 | -0.08 | -0.32 | 1.77 | 1.37 | 0.87 |
| – Electric and gas utilities | -0.49 | 0.09 | 0.68 | -0.40 | 0.77 | 0.28 | -0.37 | -0.61 | 0.13 |
| – – Electric power generation, transmn and distrn. | -0.28 | 0.02 | 0.56 | -0.32 | 0.57 | 0.29 | -0.20 | -0.46 | 0.12 |
| – – Natural gas distribution | -0.20 | 0.07 | 0.12 | -0.08 | 0.20 | -0.01 | -0.17 | -0.15 | 0.01 |
Click to enlarge
Click to enlarge