From the Federal Reserve (our emphasis in bold):
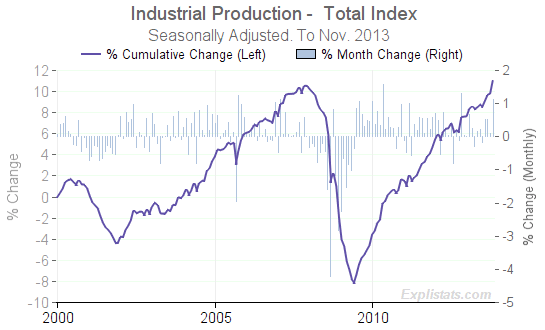
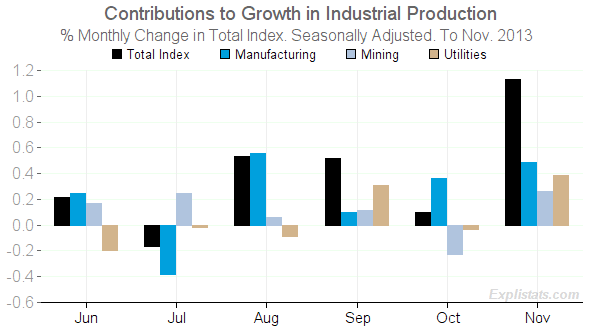
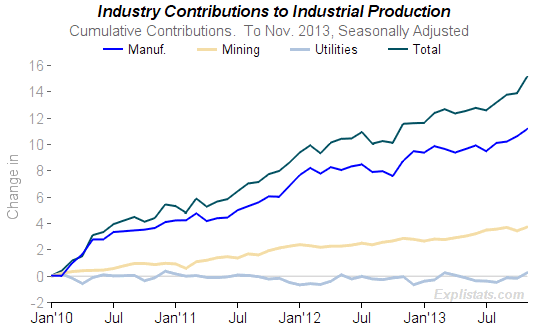
Industrial production increased 1.1 percent in November after having edged up 0.1 percent in October; output was previously reported to have declined 0.1 percent in October. The gain in November was the largest since November 2012, when production rose 1.3 percent. Manufacturing output increased 0.6 percent in November for its fourth consecutive monthly gain. Production at mines advanced 1.7 percent to more than reverse a decline of 1.5 percent in October. The index for utilities was up 3.9 percent in November, as colder-than-average temperatures boosted demand for heating. At 101.3 percent of its 2007 average, total industrial production was 3.2 percent above its year-earlier level. In November, industrial production surpassed for the first time its pre-recession peak of December 2007 and was 21 percent above its trough of June 2009. Capacity utilization for the industrial sector increased 0.8 percentage point in November to 79.0 percent, a rate 1.2 percentage points below its long-run (1972-2012) average.

Click to enlarge
The index has now surpassed its previous peak value, set almost six years ago, in December 2007.
More detailed breakdowns and charts available on our Industrial Production Data-set Page.
| U.S. Industrial Production – Major Industry Groups Changes by Sub-Index. Seasonally Adjusted. |
|||||||||
|---|---|---|---|---|---|---|---|---|---|
| Percentage Change of Sub-Indexes |
Monthly Change (%) | 3-Month Change (%) | Year/Year Change (%) | ||||||
| Sep. 2013 |
Oct. 2013 |
Nov. 2013 |
to May 2013 |
to Aug. 2013 |
to Nov. 2013 |
Sep. 2013 |
Oct. 2013 |
Nov. 2013 |
|
| Total index | 0.52 | 0.10 | 1.13 | 0.14 | 0.58 | 1.75 | 3.19 | 3.42 | 3.23 |
| – Manufacturing (SIC) | 0.13 | 0.48 | 0.65 | -0.26 | 0.55 | 1.27 | 2.71 | 3.66 | 2.89 |
| – – Durable manufacturing | 0.44 | 0.65 | 0.78 | -0.19 | 1.15 | 1.88 | 4.95 | 5.79 | 4.52 |
| – – Nondurable manufacturing | -0.35 | 0.39 | 0.50 | -0.31 | -0.06 | 0.55 | 0.57 | 1.72 | 1.41 |
| – – Other manufacturing | 1.68 | -0.72 | 0.62 | -0.75 | -0.15 | 1.57 | -1.54 | -1.57 | -1.45 |
| – Mining | 0.76 | -1.47 | 1.69 | 1.32 | 3.15 | 0.95 | 6.92 | 4.65 | 5.16 |
| – Electric and gas utilities | 3.21 | -0.33 | 3.91 | 1.44 | -3.11 | 6.90 | 1.26 | -0.25 | 2.84 |
| – – Electric power generation, transmn and distrn. | 3.55 | 0.03 | 3.80 | 1.47 | -3.49 | 7.51 | 1.59 | 0.72 | 3.75 |
| – – Natural gas distribution | 0.81 | -2.99 | 4.80 | 1.26 | -0.26 | 2.48 | -1.14 | -7.10 | -3.59 |

Click to enlarge
Utilities: Contributed 0.38% points

Click to enlarge
