For more charts and tables at finer levels of detail, please visit our Latest Industrial Production Charts and Tables Page.
From the Federal Reserve’s G.17 Report:
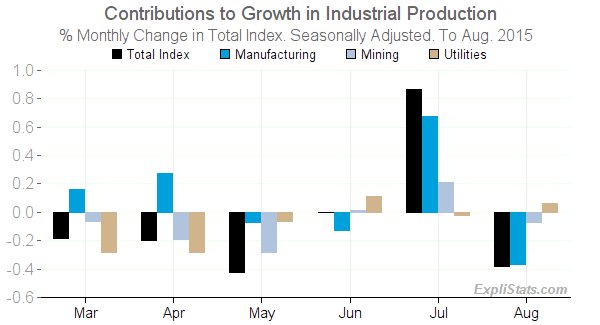
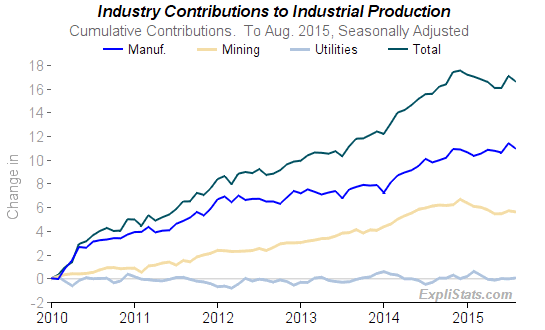
Industrial production decreased 0.4 percent in August after increasing 0.9 percent in July. The increase in July is now estimated to be greater than originally reported last month, largely as a result of upward revisions for mining and utilities. Manufacturing output fell 0.5 percent in August primarily because of a large drop in motor vehicles and parts that reversed a substantial portion of its jump in July; production elsewhere in manufacturing was unchanged. The index for mining fell 0.6 percent in August, while the index for utilities rose 0.6 percent. At 107.1 percent of its 2012 average, total industrial production in August was 0.9 percent above its year-earlier level. Capacity utilization for the industrial sector fell 0.4 percentage point in August to 77.6 percent, a rate that is 2.5 percentage points below its long-run (1972–2014) average.
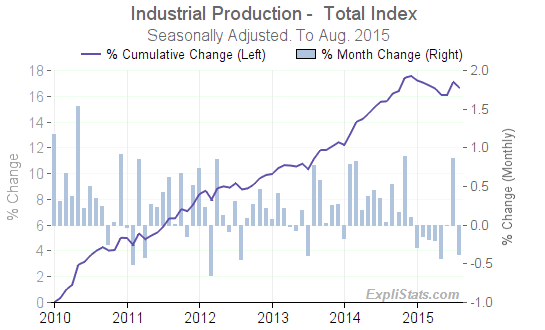
Click to enlarge
| U.S. Industrial Production – Major Industry Groups Contribution to Total Index of each Industry Group. Seasonally Adjusted. | |||||||||
|---|---|---|---|---|---|---|---|---|---|
| Total Index % Points Change by Sub-Index | Monthly Change (Pts) | 3-Month Change (Pts) | Year/Year Change (Pts) | ||||||
| June 2015 | July 2015 | Aug. 2015 | to Feb. 2015 | to May 2015 | to Aug. 2015 | June 2015 | July 2015 | Aug. 2015 | |
| Total index | -0.00 | 0.87 | -0.38 | -0.34 | -0.81 | 0.48 | 0.80 | 1.33 | 0.91 |
| – Manufacturing (SIC) | -0.13 | 0.67 | -0.37 | -0.49 | 0.36 | 0.18 | 0.99 | 1.13 | 1.02 |
| – – Durable manufacturing | -0.09 | 0.47 | -0.35 | -0.45 | 0.29 | 0.02 | 0.56 | 0.60 | 0.49 |
| – – Nondurable manufacturing | -0.00 | 0.20 | -0.01 | -0.00 | 0.07 | 0.18 | 0.65 | 0.72 | 0.68 |
| – – Other manufacturing | -0.03 | 0.00 | -0.00 | -0.04 | -0.00 | -0.03 | -0.23 | -0.19 | -0.15 |
| – Mining | 0.01 | 0.21 | -0.07 | -0.12 | -0.54 | 0.15 | -0.32 | -0.21 | -0.43 |
| – Electric and gas utilities | 0.11 | -0.02 | 0.06 | 0.27 | -0.63 | 0.16 | 0.13 | 0.40 | 0.32 |
| – – Electric power generation, transmn and distrn. | 0.06 | -0.02 | 0.05 | 0.20 | -0.40 | 0.09 | 0.11 | 0.39 | 0.28 |
| – – Natural gas distribution | 0.05 | -0.00 | 0.01 | 0.07 | -0.23 | 0.06 | 0.03 | 0.01 | 0.04 |
Click to enlarge
Click to enlarge
This article was generated automatically from our database. We can automate custom reports, spreadsheets and data feeds for our clients. Please contact us with your requirements.