Click to enlarge
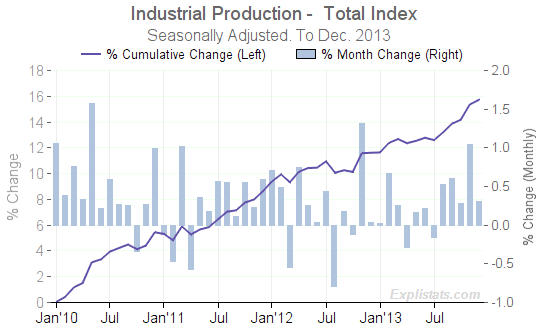
November’s strong growth was revised downwards from 1.13% to 1.04%.
Durable Goods production was essentially flat, while Utilities fell back 1.42%
More detailed breakdowns and charts available on our Industrial Production Data-set Page.
| U.S. Industrial Production – Major Industry Groups Changes by Sub-Index. Seasonally Adjusted. |
|||||||||
|---|---|---|---|---|---|---|---|---|---|
| Percentage Change of Sub-Indexes |
Monthly Change (%) | 3-Month Change (%) | Year/Year Change (%) | ||||||
| Oct. 2013 |
Nov. 2013 |
Dec. 2013 |
to June 2013 |
to Sep. 2013 |
to Dec. 2013 |
Oct. 2013 |
Nov. 2013 |
Dec. 2013 |
|
| Total index | 0.28 | 1.04 | 0.31 | 0.09 | 0.97 | 1.63 | 3.68 | 3.40 | 3.68 |
| – Manufacturing (SIC) | 0.56 | 0.62 | 0.45 | 0.32 | 0.43 | 1.63 | 3.83 | 3.02 | 2.60 |
| – – Durable manufacturing | 0.81 | 0.79 | 0.08 | 0.51 | 1.16 | 1.69 | 5.99 | 4.73 | 4.11 |
| – – Nondurable manufacturing | 0.46 | 0.55 | 0.86 | 0.17 | -0.63 | 1.88 | 1.85 | 1.58 | 1.27 |
| – – Other manufacturing | -2.02 | -1.05 | 0.54 | -0.56 | 3.96 | -2.52 | -1.58 | -3.09 | -2.06 |
| – Mining | -1.52 | 1.85 | 0.76 | 2.69 | 2.85 | 1.07 | 4.66 | 5.34 | 6.61 |
| – Electric and gas utilities | 1.01 | 2.96 | -1.42 | -5.31 | 2.13 | 2.51 | 1.14 | 3.32 | 7.64 |
| – – Electric power generation, transmn and distrn. | 1.21 | 2.96 | -1.60 | -4.30 | 1.89 | 2.54 | 1.93 | 4.15 | 7.03 |
| – – Natural gas distribution | -0.52 | 2.96 | -0.10 | -12.31 | 3.93 | 2.33 | -4.44 | -2.56 | 12.39 |

Click to enlarge
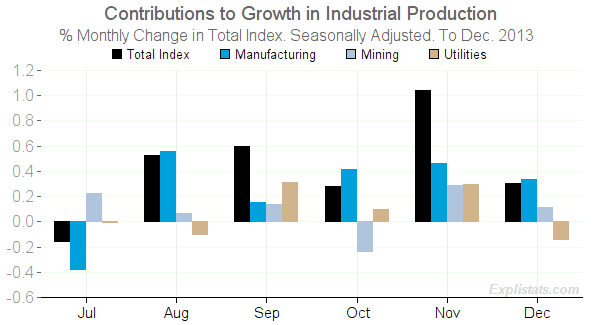
Manufacturing: Contributed 0.33% points
Mining: Contributed 0.14% points
Utilities: Contributed -0.14% points

Click to enlarge
(These do not total exactly, due to rounding.)
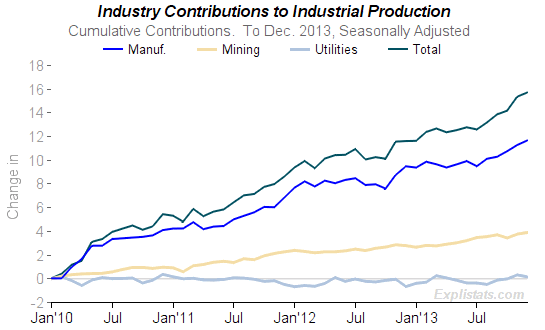
The two charts to the left show the growth in the overall index together with that of the weighted contributions of each major sector. The first chart shows the monthly changes, the second shows the levels over time.
