This is a follow-up to our previous post on Hourly Wages. The issue we raised may be a storm in a teacup – the headline number could be impacted, but we favor attributing a more limited scope to this anomaly.
We discussed our findings with a very helpful analyst at the Bureau of Labor Statistics.
For the BLS, the issue is significant in terms of the relative weekly hours worked by Production employees and All Employees for the General Merchandise retail sector. As such the picture is as shown in the chart below, where Production employees are estimated by the BLS to have been working more hours per week than All employees, since January 2017.
This is odd, and extreme enough to imply very few hours left over for Non-Production workers, which is how we at ExpliStats noticed this anomaly.
The BLS are going to take a look at this. Meanwhile, there are perhaps two explanations for what is going on:
- The hours per week estimate for Production workers is far too high. In which case, this estimation error is contained to this sub-industry and to Production (and by implication Non-Production) Employees. The headline, “All Private” average hourly wage is not impacted.
- The hours per week estimate for All Employees is far too low. This has serious consequences for the headline reported number
It seems more reasonable to assume that (1) is the case, because the All Employees data input to the system is going to be simpler and less error prone than that for the Production sub-group. And, because this estimation problem does not affect the headline, All Employee numbers there is an explanation for why the issue has not been noticed before.
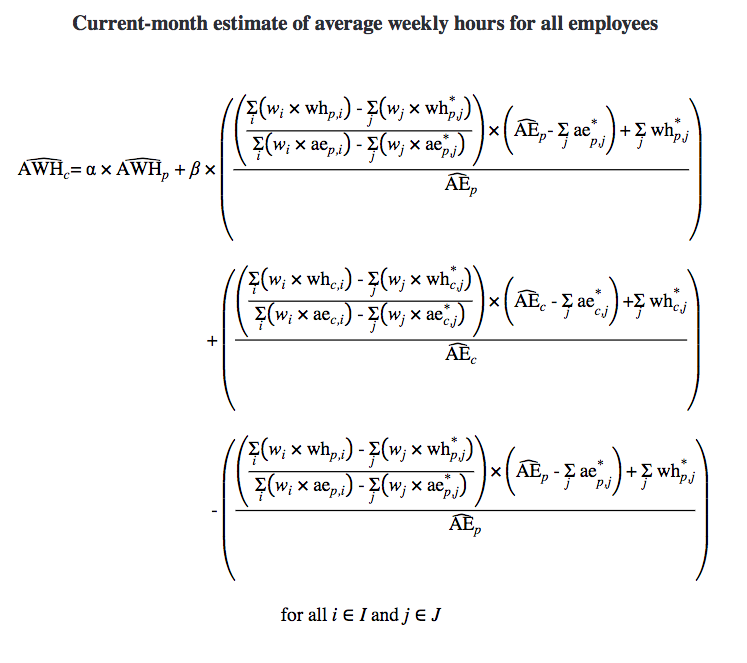
Here is part of the estimation process used by the BLS. (See BLS Handbook of Methods, Chapter 2)
Without access to the underling sample data we cannot see exactly what is going on. We might hazard a guess and say that perhaps a significant portion of the BLS’s sample of employers in this sub-sector went out of business in January 2018.
Our database of establishment counts from the BLS’ Quarterly Census of Employment and Wages (latest available data to June 2017) shows a drop in the number of General Merchandise stores in the first quarter of 2018. When we looked at the QCEW employee counts, it looks like the stores which closed were large ones. (This sub-sector includes Department Stores.)

The “j” subscripts in the above formula counts over those employers who did not respond in the survey month.
Perhaps some estimation ratio was significantly changed by the change in the sample profile? This is just speculation on our part.
Bottom line: If case (1) is indeed correct, there is no implication for the headline number, and so nothing to predict for February’s report due at the end of this week.