Click to enlarge
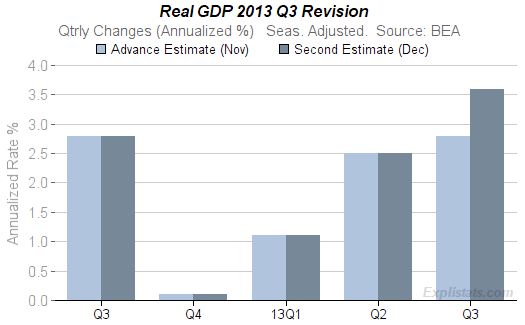
The Bureau of Economic Analysis released their second estimate for third quarter GDP. Growth in the quarter was revised up form 2.8% to 3.6% on an annualized, seasonally adjusted basis.
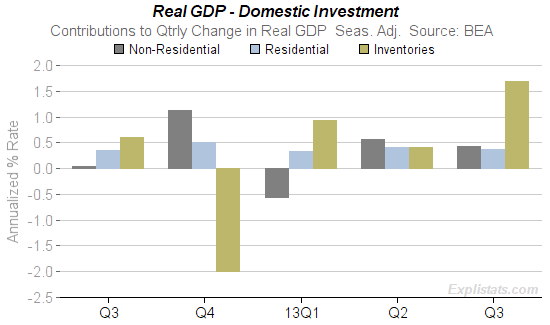
The additional growth came from a revision to the build-up in Private Inventories. Growth in Non-farm Private Inventories was revised up from a 0.7 to a 1.6 percentage point contribution to GDP Q3 growth.
A 0.9 %pt revision, with total GDP revised up by 0.8%pts.
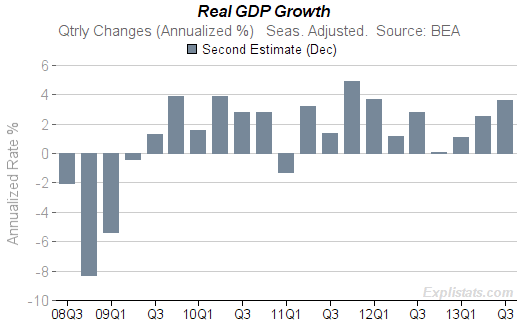
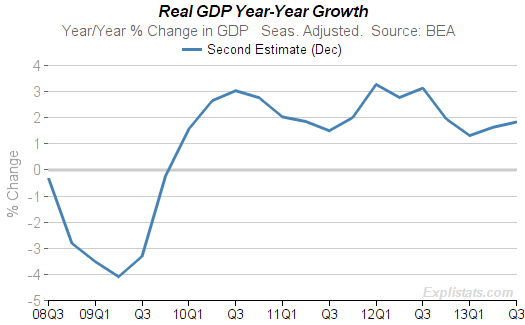
The revised time-series for GDP is shown in the two charts below: The first shows the quarter to quarter changes; the second shows the year to year change.
 Click to enlarge |
 |
Sectors within GDP and their growth
Click to enlarge
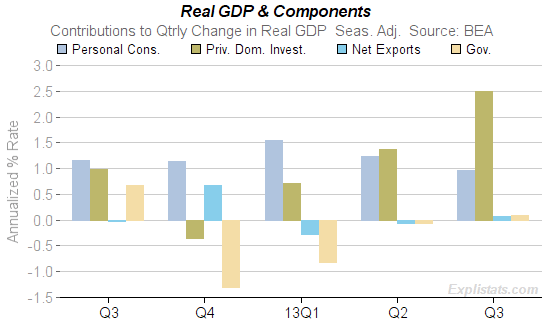
We can see that over the past four quarters, inventory build up has accelerated, with the quarterly contribution of that component moving from -0.4 to +2.5 %pts.
Personal consumption growth has been decelerating in the past two quarters.
Changes to the balance of trade has contributed little over the past two quarters.
Government expenditure and consumption has turned positive in the latest quarter.
Looking further, within the Domestic Private Investment sector, the final chart shows the contributions from its three sub-components. Again, we see the prime source of growth: Inventories. (Inventories shown here include both farm and non-farm.)
Click to enlarge
