Today’s Advance Estimate – as with all Advance Estimates – could suffer heavy revision in the coming two months as more accurate data becomes available to the Bureau of Economic Analysis.
More Charts and Tables on our GDP Data Set Page
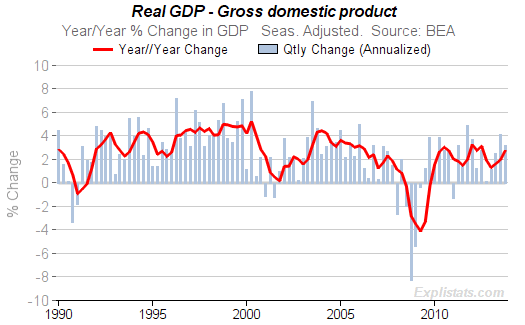
The estimate shows a growth (at an annualized rate) of 3.2%, down from a rate of 4.1% for the third quarter. (On a non-annualized basis, those two numbers would be 0.8% and 1.0% respectively).
The table below shows where the growth came from and allows a comparison with previous quarters.
| U.S. Real Gross Domestic Product Contributions to Percent Change. Seasonally Adjusted. |
|||||
|---|---|---|---|---|---|
| Quarterly Chg (Anzd.) | |||||
| Dec. 2012 |
Mar. 2013 |
June 2013 |
Sep. 2013 |
Dec. 2013 |
|
| Gross Domestic Product | 0.1 | 1.1 | 2.5 | 4.1 | 3.2 |
| – Personal Consumption Expenditures | 1.1 | 1.5 | 1.2 | 1.4 | 2.3 |
| – Gross Private Domestic Investment | -0.4 | 0.7 | 1.4 | 2.6 | 0.6 |
| – Net Exports of Goods and Services | 0.7 | -0.3 | -0.1 | 0.1 | 1.3 |
| – Government Consumption Expenditures and Gross Investment | -1.3 | -0.8 | -0.1 | 0.1 | -0.9 |
And, in graphical form:
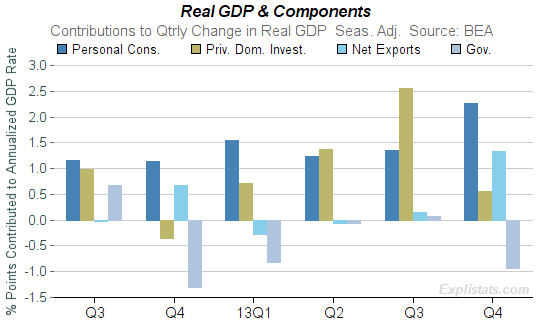
Personal Consumption accelerated (due mainly to Food Services & Accomodation – see below)
Private Investment decelerated (Residential investment fell, and inventory build-up slowed)
The trade picture improved
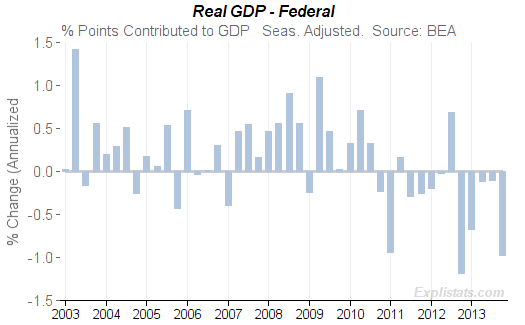
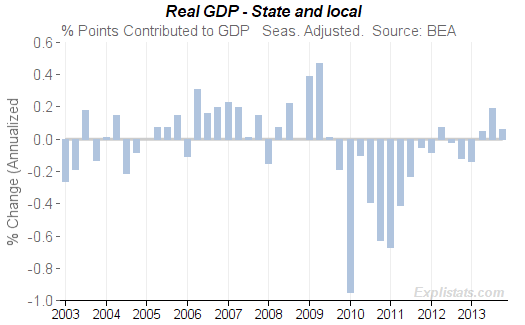
Government’s contribution shrank (all due to Federal spending).
Personal Consumption Expenditures contributed 2.3% points, up sharply from the range 1.1-1.5% seen in the past four quarters.
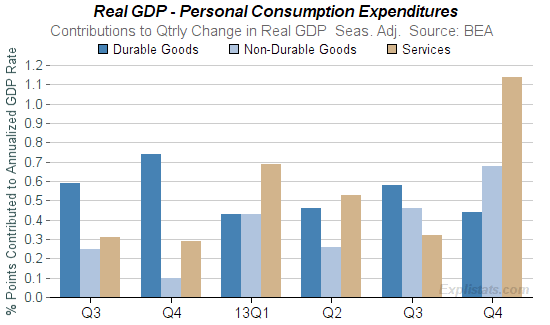
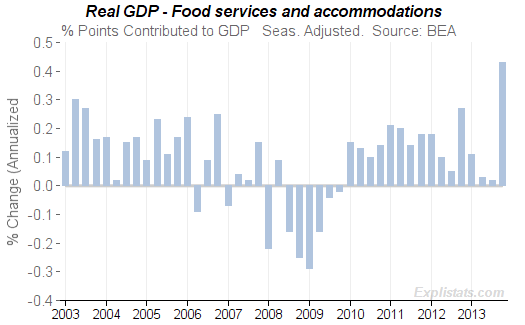
Most of this growth came from the Services sector, where Housing & Utilities reversed a fall, and Food Services & Accommodation posted 10.2% annualized growth in the fourth quarter, contributing 0.4% points to overall GDP growth.
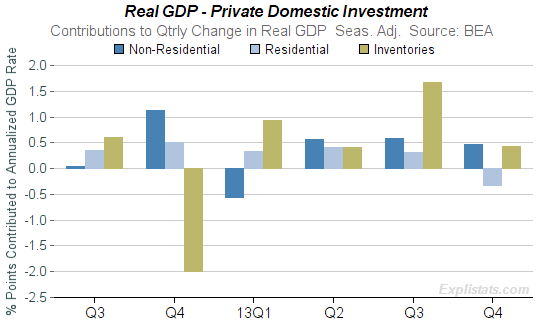
Private Domestic Investment contributed 0.6% points, down from a 2.3% points contribution in the third quarter.
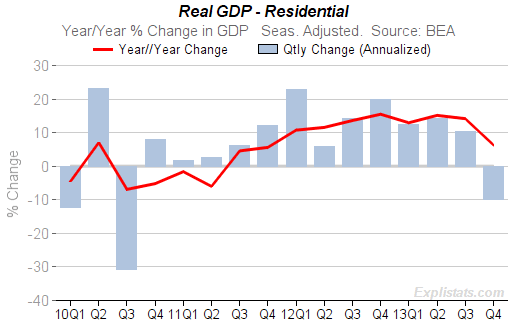
This reduction was due to a fall in Residential Investment, and a reduced rise in Inventory build-up.
Net Trade contributed 1.3% points, up from 0.1% points in the third quarter, due almost entirely to a 1.5% contribution from the export of goods.
| U.S. Real Gross Domestic Product Contributions to Percent Change. Seasonally Adjusted. |
|||||
|---|---|---|---|---|---|
| Quarterly Chg (Anzd.) | |||||
| Dec. 2012 |
Mar. 2013 |
June 2013 |
Sep. 2013 |
Dec. 2013 |
|
| – Net Exports of Goods and Services | 0.7 | -0.3 | -0.1 | 0.1 | 1.3 |
| – – Exports | 0.1 | -0.2 | 1.0 | 0.5 | 1.5 |
| – – – Goods | -0.3 | -0.3 | 0.8 | 0.5 | 1.3 |
| – – – Services | 0.4 | 0.1 | 0.2 | 0.0 | 0.1 |
| – – Imports | 0.5 | -0.1 | -1.1 | -0.4 | -0.1 |
| – – – Goods | 0.5 | 0.0 | -1.0 | -0.3 | -0.1 |
| – – – Services | 0.0 | -0.1 | -0.1 | -0.1 | -0.0 |
Government’s contribution was a 0.9% point reduction. This came from the Federal Government (a negative 1.0% point contribution), while State & Local grew slightly.
