The Bureau of Economic Analysis released its First Estimate of 2014 3rd Qtr GDP this morning.
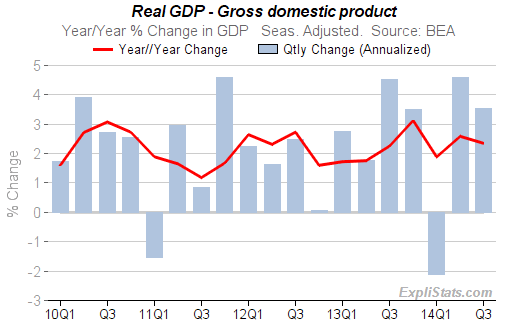
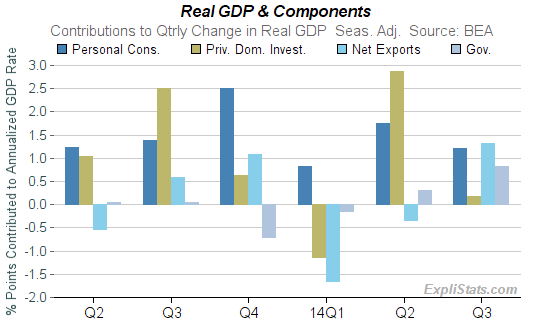
The 3.5% annualized gain in the quarter comprised: contributions from the four sub-categories as shown in the chart and table below.
(For more such charts please see our “Cross Section” tab on our current GDP data page.
| U.S. Real Gross Domestic Product Contributions to Percent Change. Seasonally Adjusted. |
|||||
|---|---|---|---|---|---|
| Quarterly Chg (Anzd.) | |||||
| Sep. 2013 |
Dec. 2013 |
Mar. 2014 |
June 2014 |
Sep. 2014 |
|
| Gross Domestic Product | 4.5 | 3.5 | -2.1 | 4.6 | 3.5 |
| – Personal Consumption Expenditures | 1.4 | 2.5 | 0.8 | 1.8 | 1.2 |
| – Gross Private Domestic Investment | 2.5 | 0.6 | -1.1 | 2.9 | 0.2 |
| – Net Exports of Goods and Services | 0.6 | 1.1 | -1.7 | -0.3 | 1.3 |
| – Government Consumption Expenditures and Gross Investment | 0.0 | -0.7 | -0.1 | 0.3 | 0.8 |
A full 0.7% came from Defense expenditures within the last sector listed above. (This table can be expanded on our Gross Domestic Charts and Tables page, currently showing today’s release.)
For different timescales and sectors, please visit our GDP Sectors Chart page.