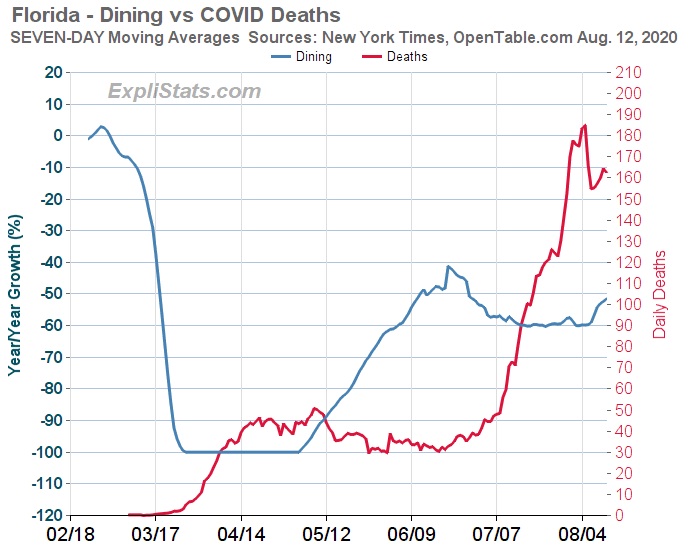
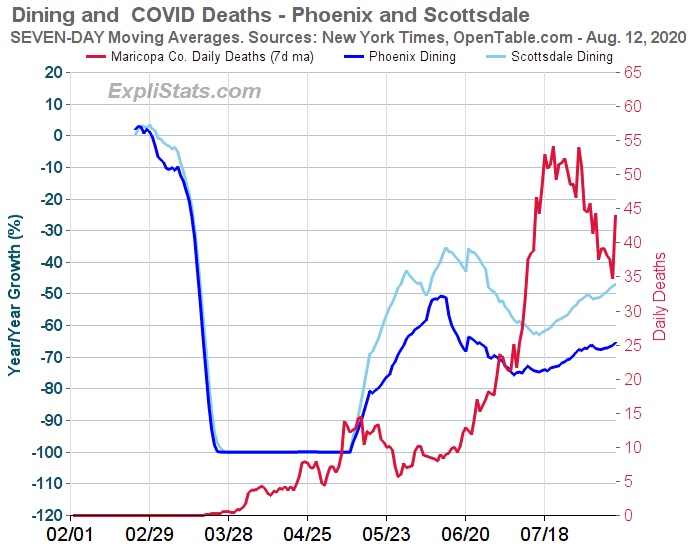
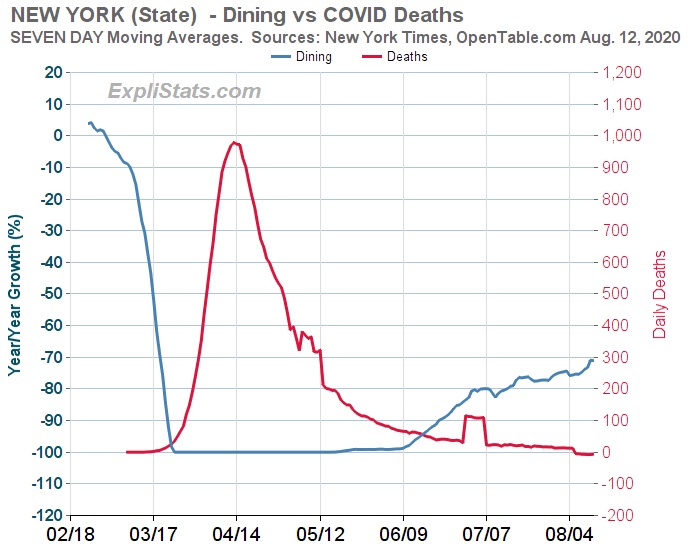
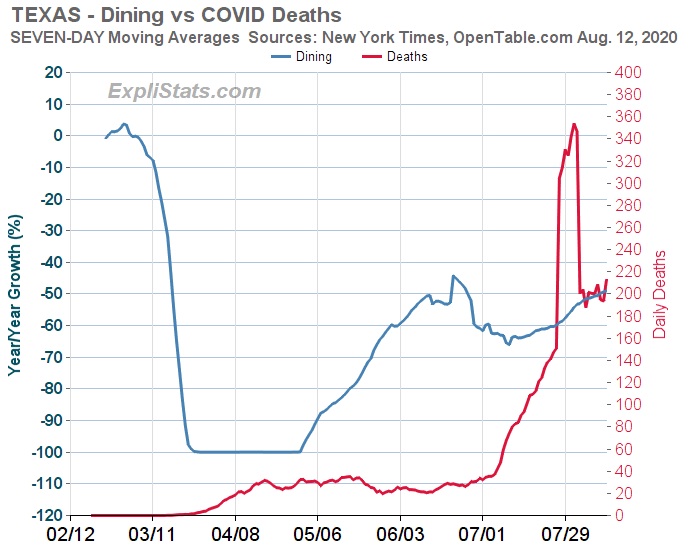
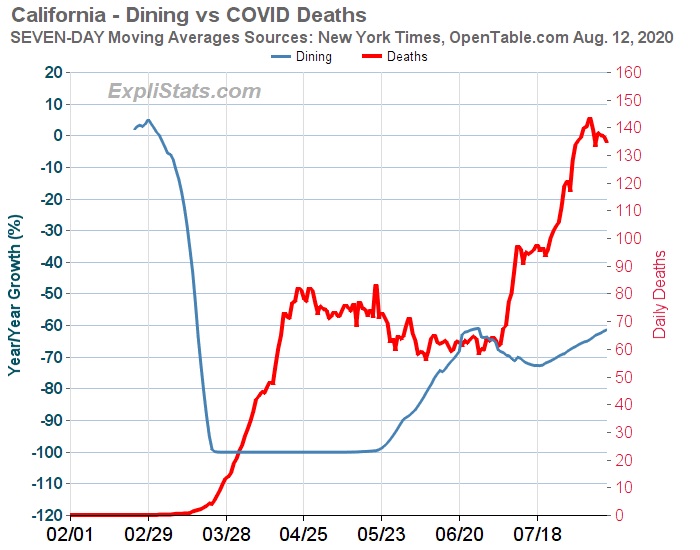
We have combined the COVID mortality statistics provided by the New York Times, with the data on restaurant dining provided by OpenTable.com.
We have eschewed the statistics on confirmed Covid cases to avoid having to consider testing rate variations over time and place.
In the charts below we see, with the exception of New York, that death rates seem to correlate with dining levels with a lag of about six to eight weeks.
This is not so say that dining caused the deaths, but dining might be used as a correlate for less social distancing.
It will be interesting to see in the coming weeks whether there will be an uptick in deaths six or seven weeks after the dip in dining following the initial re-opening surge.
Note: A few week-long spikes which appear are due to states releasing, on one day, updated figures for past deaths without giving dates)