Yesterday, the Census Department published the delayed October and September Construction Spending Surveys. Total construction spending in October was at a seasonally-adjusted, annualized rate of $908.4Bn, up about 0.5% from a revised August figure, and up 5.3% from a year previous.
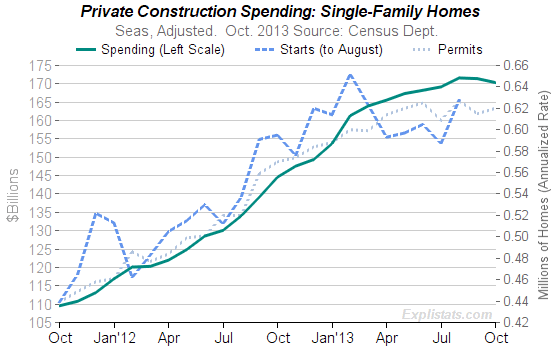
Of particular interest though, is the private residential spending levels. Here, the data suggests that Single Family starts may have fallen in the two-month period of September and October.
Remember that the Housing Starts data for September and October which should have been published in October and November respectively are not expected until December 18th.
Click to enlarge
First thing to note is that dollars spent on new, single-family homes decreased in both August and September (on a seasonally-adjusted basis). This is the first time this has happened since early 2011.
Second, on a visual examination of the correlation of the three, it is hard to see how Starts can come in with any strong increase for the latest two months.
A caveat: The spending data is often subject to sizable revisions, and this coupled with the disruption to the surveying process caused by the Federal government shut-down, means this latest “trend” needs to be taken with a pinch of salt.
Click to enlarge
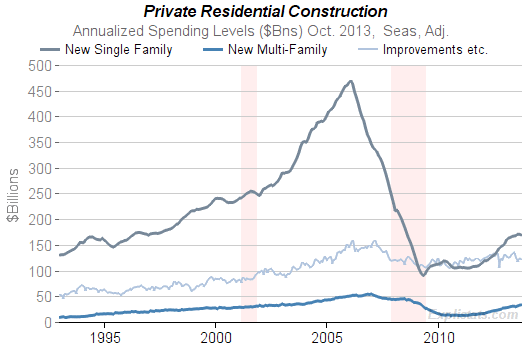
New Multi-Family (apartments), and other construction on existing buildings labeled “Improvements”.
The latter includes everything done to maintain, extend or improve an existing residential building, including major fixtures. (*See below for full definition)
Note that since 1995, spending on new homes is about at the same dollar level (though lower if inflation is taken into account), whereas spending on Improvements has roughly doubled.
Overall Construction Spending
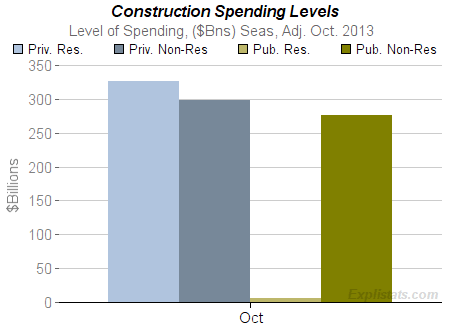
Private residential construction currently accounts for just over one third of total construction spending. Almost the same level of spending is seen in each of private and public non-residential construction. (Public residential construction is minimal.)
 Click to enlarge |
 Click to enlarge |
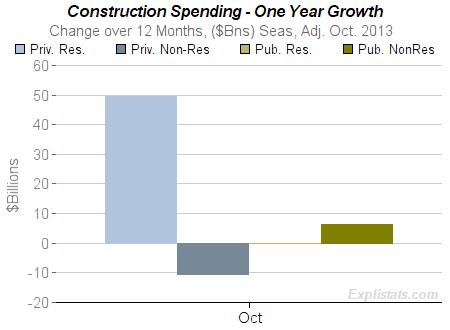
Most of the growth over the last year has come from private residential construction.
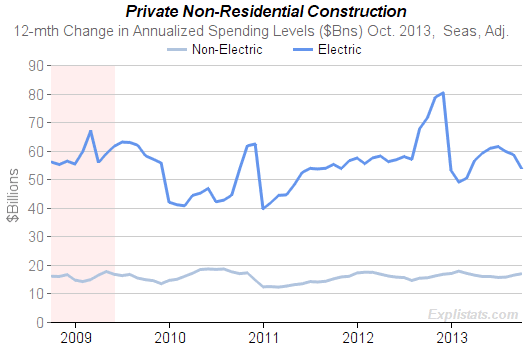
Click to enlarge
Private non-residential growth is negative because of a drop in construction related to electric power generation and distribution.
Or rather, the year-year change is mostly due to a surge in spending a year ago.( (See chart on left.)
(*) Residential Improvements. From the Census Dept: Includes remodeling, additions, and major replacements to owner occupied properties subsequent to completion of original building. It includes construction of additional housing units in existing residential structures, finishing of basements and attics, modernization of kitchens, bathrooms, etc. Also included are improvements outside of residential structures, such as the addition of swimming pools and garages, and replacement of major equipment items such as water heaters, furnaces and central air-conditioners. Maintenance and repair work is not included.
