The Census Department’s survey of Construction Spending for November was released today. It included revisions to September and October.
Overall, for all types of construction, spending in November was at a seasonally adjusted annual rate of $934.4 billion, 1.0 percent (±1.6%). Private construction rose 2.2% (±1.2%) in November, to $659.4 billion. Public spending on construction fell by 1.8% (±2.5%) to $275.0 billion.
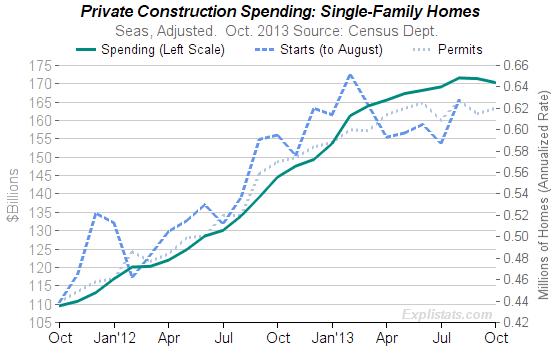
Of particular interest to us were the numbers for private construction spending on new single-family homes. Because of the delays caused by the October shutdown of the Census Department, the October Construction Spending survey was published before the corresponding data for Housing Starts. We reviewed the (then reported) drop in spending in our post, “Construction Spending – Suggests a fall in Single-Family Starts”.

Click to enlarge
As can be seen from the chart, the upward trend in spending showed signs of having topped out in August, with a combined fall of 0.7% in September-October.
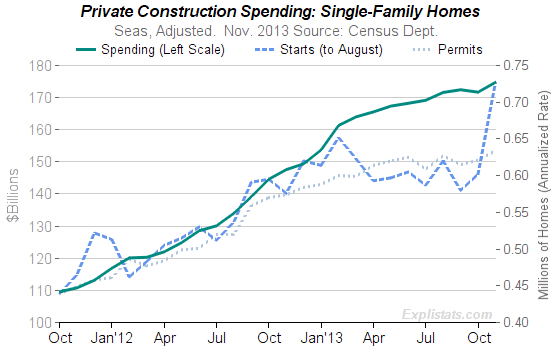
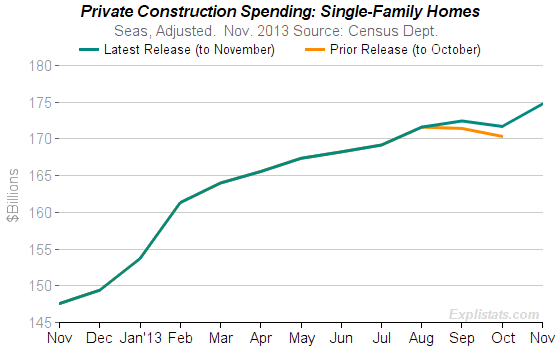
However, today’s revised numbers now show an overall growth in that two-month period, of 0.1%, followed by November’s relatively large rise of 1.8%
Overall, spending in this sector has, with revision and November’s numbers, reasserted the fairly steady trend in increased spending.
The revised chart up to November is show below left (with the latest Housing Starts and Permits), and for comparison, the October and November series are shown in the chart on the right.
 Click to enlarge |
 Click to enlarge |
