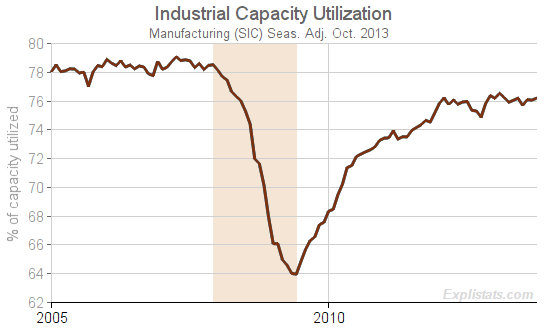
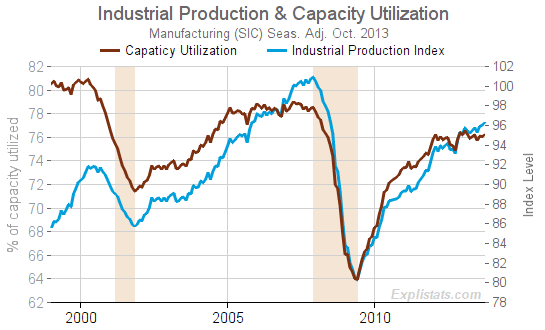
While Industrial Production continues in its upward trend, Capacity Utilization has remained flat for the past eighteen months or so. This has been accompanied by continued strong I.P. growth in the past – see second chart.
 Click to enlarge |
 Click to enlarge |
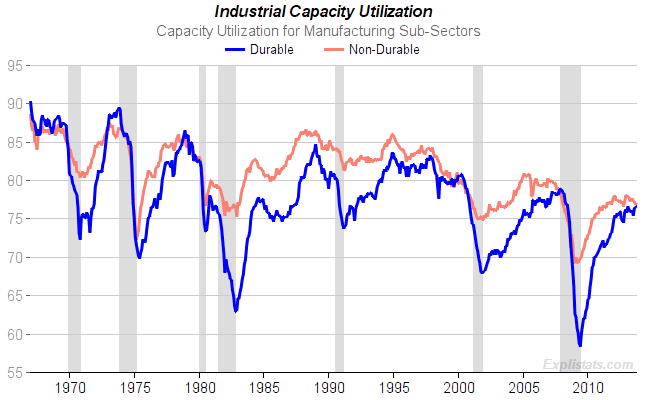
We notice, though, an interesting relationship between utilization in different major sectors within manufacturing: Whenever the utilization level in the Non-Durable sector, exceeds that in the Durable sector, a recession often soon follows.
Click to enlarge
If we plot the difference in utilization levels, below, we see a more striking picture.
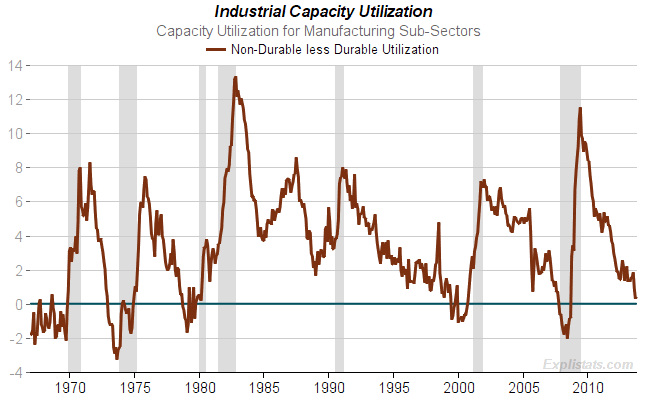
Click to enlarge
How might this be explained? Perhaps consumer-led recessions are picked up earlier by the Non-Durable goods manufacturing sector where utilization levels are more readily adjusted to final demand. This sector’s utilization on its own is not an indicator, but if we “normalize’ it by comparing it with another, related sector – Durable goods manufacturing – we can detect a significance in any downturn in Non-Durable utilization not matched by one in the Durable sector.
This seems to have worked quite well as a leading indicator in the past. The fact that the difference in the two levels is almost at zero now is something we will be watching in coming survey releases.