Retail Sales
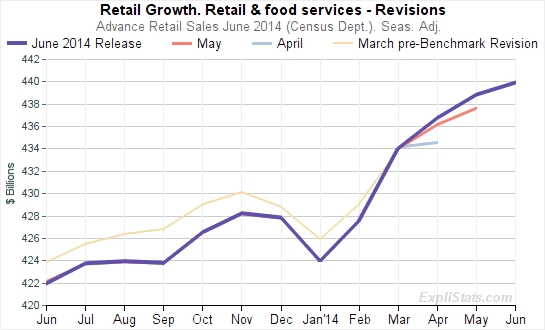
June retail sales up by 0.2%, but after upward revisions to May and April.
For more breakdowns and views of this week’s release, please see our Interactive Charts and Tables page for Retail Sales.
Producer Price Index
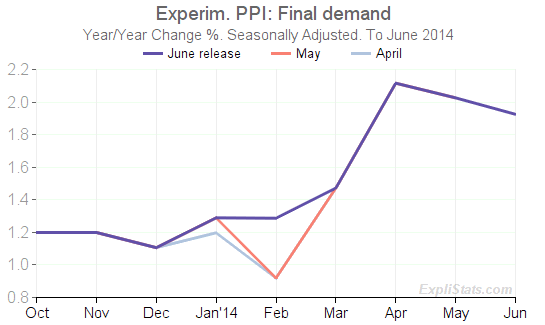
The new, Final Demand PPI of Goods and Services dropped to an annual inflation rate (yr/yr) of 2.14% in June, down from an unrevised rate of 2.33% in May.
For more breakdowns and views of this week’s release, please see our Interactive Charts and Tables page for the PPI.
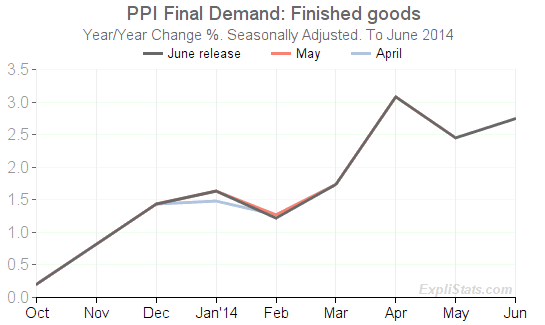
The old, headline “Finished Products” rate rose to annual inflation rate (yr/yr) in June of 2.75%. Up from an unrevised level of 2.45% in May.
Industrial Production
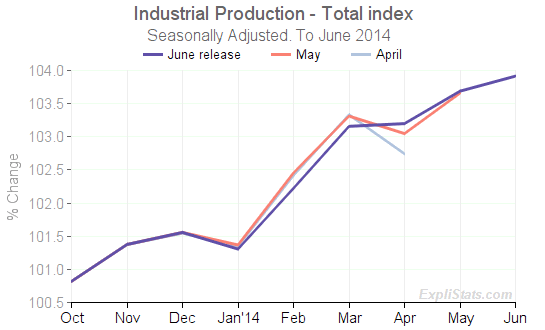
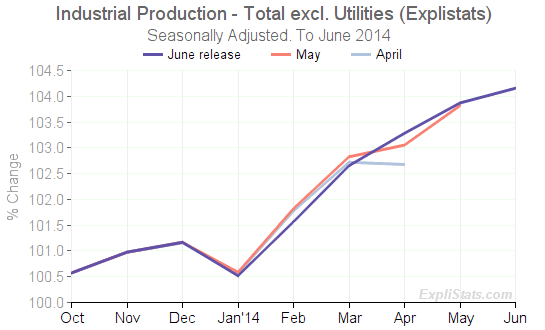
The index for total Industrial Production rose by 0.73% in June after a minimal upward revision to the May index level. Note, though, that the April level was again revised upward: What was reported as a sizeable drop in April, is now seen as a slight increase.
For more breakdowns and views of this week’s release, please see our Interactive Charts and Tables page for Industrial Production.
Out of interest, we have stripped out the volatile contribution of Utilities, leaving Manufacturing and Mining/Oil Extraction. This sub-index is no following a smooth but decelerating growth since the down-tick in January.
Residential Construction
This was covered in the preceding post.
