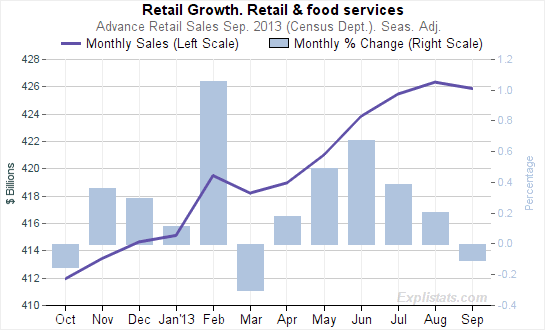
September retails sales were today reported by the Census Department as having fallen by $461M or 0.1% compared with the (revised) August figure.
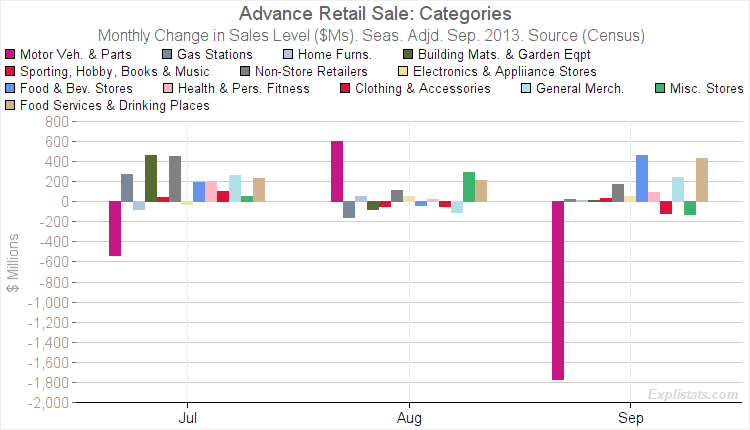
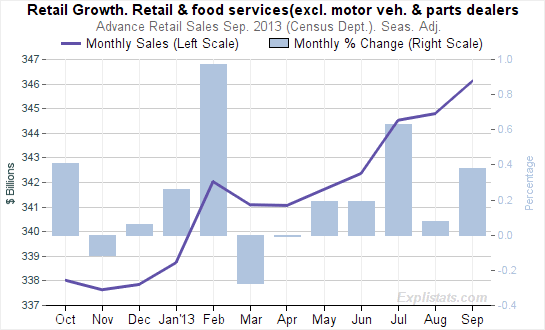
This figure was swamped by the single category of Motor Vehicle & Parts Dealers, which dropped by $1.77bn or 2.2%.
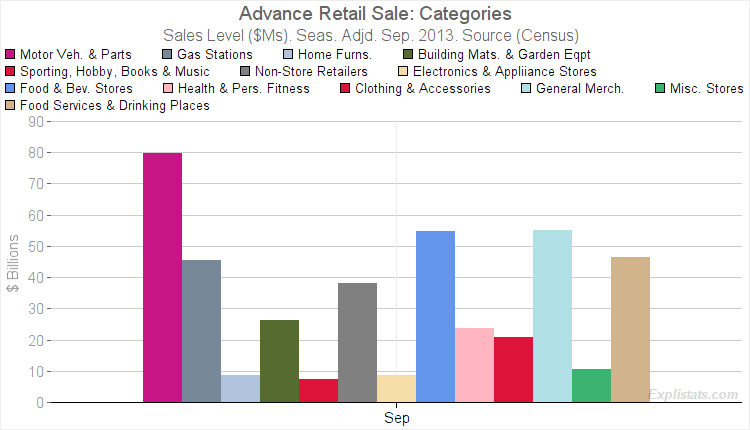
The two charts below show, first, the distribution of sales growth across different categories for the past three months, and secondly the total September sales across the same categories.

Click to enlarge

Click to enlarge

Click to enlarge

Click to enlarge
Revisions to prior months sales were minimal.
