For more charts and tables at finer levels of detail, please visit our Payrolls Dataset Page.
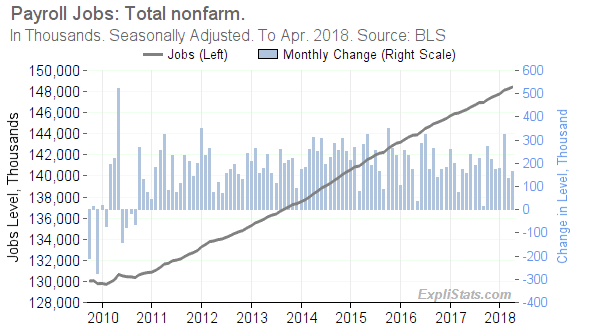
Click to enlarge
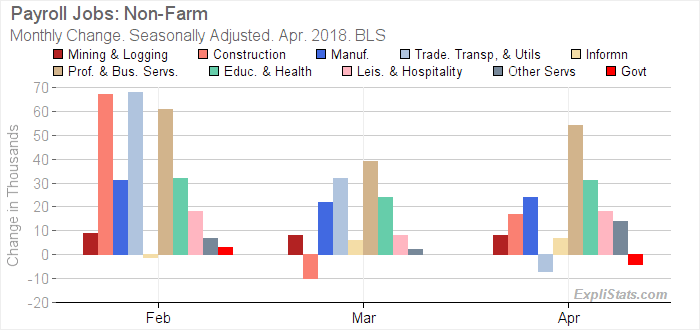
Gains across the major employment sectors are shown in the bar-chart and table below.
Click to enlarge
| U.S. Payroll Jobs: Total Nonfarm. Seasonally Adjusted. | |||||||||
|---|---|---|---|---|---|---|---|---|---|
| Sector | Level (000s) | Monthly Change (000s) | Mthly Chg (%) | Yr/Yr Change (000s)* | Yr/Yr Chg (%)* | ||||
| Apr. 2018 | Feb. 2018 | Mar. 2018 | Apr. 2018 | Apr. 2018 | Feb. 2018 | Mar. 2018 | Apr. 2018 | Apr. 2018 | |
| Total Nonfarm | 148,424 | 324.0 | 135.0 | 164.0 | 0.11 | 2,229.0 | 2,291.0 | 2,280.0 | 1.56 |
| – Total Private | 126,106 | 321.0 | 135.0 | 168.0 | 0.13 | 2,216.0 | 2,283.0 | 2,277.0 | 1.84 |
| – – Mining and Logging | 730 | 9.0 | 8.0 | 8.0 | 1.11 | 59.0 | 62.0 | 59.0 | 8.79 |
| – – Construction | 7,174 | 67.0 | -10.0 | 17.0 | 0.24 | 248.0 | 235.0 | 257.0 | 3.72 |
| – – Manufacturing | 12,655 | 31.0 | 22.0 | 24.0 | 0.19 | 219.0 | 231.0 | 245.0 | 1.97 |
| – – Trade, Transportation, and Utilities | 27,720 | 68.0 | 32.0 | -7.0 | -0.03 | 247.0 | 300.0 | 289.0 | 1.05 |
| – – Information | 2,772 | -1.0 | 6.0 | 7.0 | 0.25 | -51.0 | -44.0 | -26.0 | -0.93 |
| – – Financial Activities | 8,549 | 29.0 | 4.0 | 2.0 | 0.02 | 139.0 | 137.0 | 126.0 | 1.50 |
| – – Professional and Business Services | 20,869 | 61.0 | 39.0 | 54.0 | 0.26 | 511.0 | 514.0 | 518.0 | 2.55 |
| – – Education and Health Services | 23,517 | 32.0 | 24.0 | 31.0 | 0.13 | 445.0 | 446.0 | 431.0 | 1.87 |
| – – Leisure and Hospitality | 16,272 | 18.0 | 8.0 | 18.0 | 0.11 | 309.0 | 310.0 | 279.0 | 1.74 |
| – – Other Services | 5,848 | 7.0 | 2.0 | 14.0 | 0.24 | 90.0 | 92.0 | 99.0 | 1.72 |
| – Government | 22,318 | 3.0 | 0.0 | -4.0 | -0.02 | 13.0 | 8.0 | 3.0 | 0.01 |
This article was generated automatically from our database. We can automate custom reports, spreadsheets and data feeds for our clients. Please contact us with your requirements.