For more charts and tables at finer levels of detail, please visit our Payrolls Dataset Page.
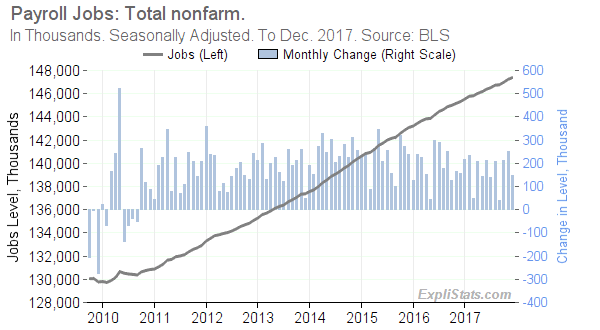
Click to enlarge
Gains across the major employment sectors are shown in the bar-chart and table below.
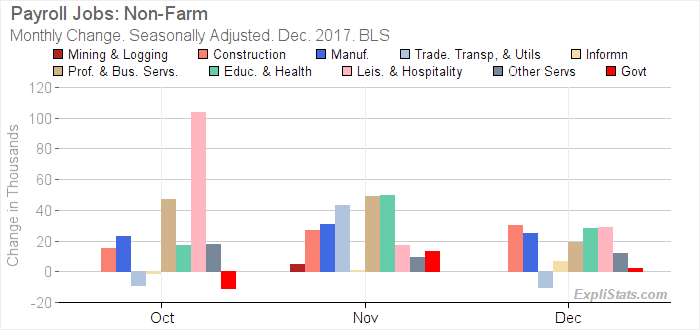
Click to enlarge
| U.S. Payroll Jobs: Total Nonfarm. Seasonally Adjusted. | |||||||||
|---|---|---|---|---|---|---|---|---|---|
| Sector | Level (000s) | Monthly Change (000s) | Mthly Chg (%) | Yr/Yr Change (000s)* | Yr/Yr Chg (%)* | ||||
| Dec. 2017 | Oct. 2017 | Nov. 2017 | Dec. 2017 | Dec. 2017 | Oct. 2017 | Nov. 2017 | Dec. 2017 | Dec. 2017 | |
| Total Nonfarm | 147,380 | 211.0 | 252.0 | 148.0 | 0.10 | 1,974.0 | 2,062.0 | 2,055.0 | 1.41 |
| – Total Private | 125,039 | 222.0 | 239.0 | 146.0 | 0.12 | 1,956.0 | 2,017.0 | 2,013.0 | 1.64 |
| – – Mining and Logging | 727 | 0.0 | 5.0 | 0.0 | 0.00 | 63.0 | 61.0 | 59.0 | 8.83 |
| – – Construction | 6,993 | 15.0 | 27.0 | 30.0 | 0.43 | 193.0 | 192.0 | 210.0 | 3.10 |
| – – Manufacturing | 12,539 | 23.0 | 31.0 | 25.0 | 0.20 | 158.0 | 189.0 | 196.0 | 1.59 |
| – – Trade, Transportation, and Utilities | 27,448 | -9.0 | 43.0 | -10.0 | -0.04 | 84.0 | 112.0 | 74.0 | 0.27 |
| – – Information | 2,722 | -1.0 | 1.0 | 7.0 | 0.26 | -66.0 | -53.0 | -40.0 | -1.45 |
| – – Financial Activities | 8,498 | 8.0 | 7.0 | 6.0 | 0.07 | 155.0 | 150.0 | 134.0 | 1.60 |
| – – Professional and Business Services | 20,943 | 47.0 | 49.0 | 19.0 | 0.09 | 541.0 | 544.0 | 527.0 | 2.58 |
| – – Education and Health Services | 23,309 | 17.0 | 50.0 | 28.0 | 0.12 | 441.0 | 460.0 | 438.0 | 1.92 |
| – – Leisure and Hospitality | 16,050 | 104.0 | 17.0 | 29.0 | 0.18 | 309.0 | 282.0 | 306.0 | 1.94 |
| – – Other Services | 5,810 | 18.0 | 9.0 | 12.0 | 0.21 | 78.0 | 80.0 | 109.0 | 1.91 |
| – Government | 22,341 | -11.0 | 13.0 | 2.0 | 0.01 | 18.0 | 45.0 | 42.0 | 0.19 |
This article was generated automatically from our database. We can automate custom reports, spreadsheets and data feeds for our clients. Please contact us with your requirements.